Friday, February 13, 2009
Friday, February 6, 2009
U3 and U6 Unemployment UPDATE 2
The employmeny data for the period of 1900 - 1947 may be found in Bicentennial Edition: Historical Statistics of the United States, Colonial Times to 1970
The methodology for the collection of this data is not identical to U3 in 1948, but does appear to be fairly close. So for the following charts The unemployment data from the Bicentennial Edition: Historical Statistics of the United States, Colonial Times to 1970 will be treated as a U3 analogue.
This raises the question of the U3/U6 ratio. if the ratio of 1.77 applies for the period of 1948 to present can we apply it to 1900 - 1947? The implication is that unemployment was much higher in the depression then is currently accepted ( a peak of 44%).
I suspect that the ratio would become a much looser fit the further back we go but it should still provide us with some sort of approximation, the usefulness of which is in question without a better understanding of the underlying methodological implications.
(Click to enlarge)

U3 and U6 Unemployment UPDATE
I noticed an interesting relation between U3 and U6. if you compare the concurrent data sets avoidable from 1994 to Jan 2009, you will find that U6 = U3* 1.77. U3 is related to U6 by a factor of 1.77 There may be some underlying cause for this relation that is associated with the manner in which these two data sets are generated.
Regardless, this relation should allow us to backcast the U6 data which starts in 1994 to 1948 when U3 data begins.
Here are 2 charts showing what i call Adjusted U3 (U3 x 1.77) vs U6. Visually they are very close as well as statistically. The Standard deviation for the the data set of U6/U3 is 0.06


U3 Backcast using the 1.77 factor

Data: http://spreadsheets.google.com/ccc?key=pcD2FY_0vnXSZ8HtM2tEZUg
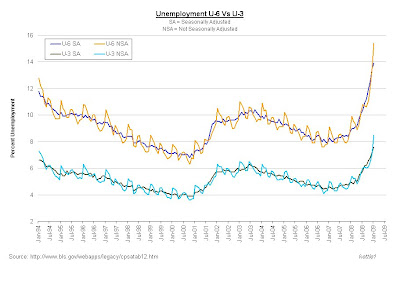
U3 and U6 Unemployment
U-3 Total unemployed, as a percent of the civilian labor force (official unemployment rate)
U-6 Total unemployed, plus all marginally attached workers, plus total employed part time for economic reasons, as a percent of the civilian labor force plus all marginally attached workers* (Real Unemployment)
*Marginally attached workers are persons who currently are neither working nor looking for work but indicate that they want and are available for a job and have looked for work sometime in the recent past. Discouraged workers, a subset of the marginally attached, have given a job-market related reason for not currently looking for a job. Persons employed part time for economic reasons are those who want and are available for full-time work but have had to settle for a part-time schedule. For further information, see "BLS introduces new range of alternative unemployment measures," in the October 1995 issue of the Monthly Labor Review.
Source: http://www.bls.gov/webapps/legacy/cpsatab12.htm
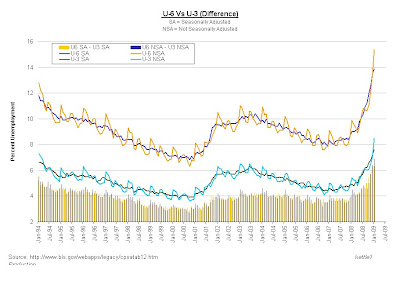
Notice that the higher unemployment is the greater the difference between U-3 and U-6......
(Click to Enlarge)
U-6 Total unemployed, plus all marginally attached workers, plus total employed part time for economic reasons, as a percent of the civilian labor force plus all marginally attached workers* (Real Unemployment)
*Marginally attached workers are persons who currently are neither working nor looking for work but indicate that they want and are available for a job and have looked for work sometime in the recent past. Discouraged workers, a subset of the marginally attached, have given a job-market related reason for not currently looking for a job. Persons employed part time for economic reasons are those who want and are available for full-time work but have had to settle for a part-time schedule. For further information, see "BLS introduces new range of alternative unemployment measures," in the October 1995 issue of the Monthly Labor Review.
Source: http://www.bls.gov/webapps/legacy/cpsatab12.htm
Notice that the higher unemployment is the greater the difference between U-3 and U-6......
(Click to Enlarge)


Subscribe to:
Posts (Atom)
