Sunday, May 24, 2009

Wired Unemployment

Looks like some of my unemployment projections were picked up by Wired magazine!

Note a small nitpick, I am not a chemist, but a Chemical Engineer. Big difference.


Wired-o-Nomics: Why Is the Real Jobless Number So Elusive?

Nick Andrews is a chemist by day and recreational economist by weekend. He’s been crunching numbers on American economic indicators for years, and in March devised a method to compare current woes with those of previous eras. Andrews collected U3 unemployment data from the early 1900s to today, and then adjusted it for compatibility (methodology changed in 1948 and again in 1994). Starting in 1994, when U6 information was first collected the way it still is today, he found a constant relation of 1.77 between U3 and U6 figures. Using this relationship, Andrews analyzed overall unemployment (U6) from the Great Depression and from today.

Sunday, May 10, 2009

Refined Unemployment Projections

I took some time over the last few days to refine the projections from my last post. Note that unless the administrations most optimistic projections for the economy are correct, then we are already looking at a depression level event occurring as we have already passed the point of no return.

As always there are exceptions. In this case the government may be able to avoid the nastier consequences of the current economic crisis through economic policies that would have been unthinkable before now. Including congress allowing the FED to issue debt. This would allow the government to subordinate a portion of the national debt and default on it or heavily devalue it while still maintaining access to international credit markets by maintaining the integrity of its super senior debt class.

Refined Projections for Unemployment (update 1)

Wednesday, May 6, 2009

2009 Unemployment projections

projection is based on High and Low scenarios. Low scenarios assume an average of 500,000 jobs lost per month for 2009 and 2010, and the high scenario assumes an average of 700,000 jobs lost per month for 2009 and 2010.

this scenario replicates what happened to the unemployment rates in 1930 using the current unemployment situation. the growth rate in unemployment is based on the current rate continuing for another 1 - 1.5 years. In reality the chart would look bumpy, with a series of wave like upward movements


Unemployment projections 2009

Friday, February 6, 2009

U3 and U6 Unemployment UPDATE 2

The employmeny data for the period of 1900 - 1947 may be found in Bicentennial Edition: Historical Statistics of the United States, Colonial Times to 1970

The methodology for the collection of this data is not identical to U3 in 1948, but does appear to be fairly close. So for the following charts The unemployment data from the Bicentennial Edition: Historical Statistics of the United States, Colonial Times to 1970 will be treated as a U3 analogue.

This raises the question of the U3/U6 ratio. if the ratio of 1.77 applies for the period of 1948 to present can we apply it to 1900 - 1947? The implication is that unemployment was much higher in the depression then is currently accepted ( a peak of 44%).

I suspect that the ratio would become a much looser fit the further back we go but it should still provide us with some sort of approximation, the usefulness of which is in question without a better understanding of the underlying methodological implications.

(Click to enlarge)


U3 and U6 Unemployment UPDATE

I noticed an interesting relation between U3 and U6. if you compare the concurrent data sets avoidable from 1994 to Jan 2009, you will find that U6 = U3* 1.77. U3 is related to U6 by a factor of 1.77 There may be some underlying cause for this relation that is associated with the manner in which these two data sets are generated.

Regardless, this relation should allow us to backcast the U6 data which starts in 1994 to 1948 when U3 data begins.

Here are 2 charts showing what i call Adjusted U3 (U3 x 1.77) vs U6. Visually they are very close as well as statistically. The Standard deviation for the the data set of U6/U3 is 0.06


U3 Backcast using the 1.77 factor


Data: http://spreadsheets.google.com/ccc?key=pcD2FY_0vnXSZ8HtM2tEZUg

U3 and U6 Unemployment

U-3 Total unemployed, as a percent of the civilian labor force (official unemployment rate)

U-6 Total unemployed, plus all marginally attached workers, plus total employed part time for economic reasons, as a percent of the civilian labor force plus all marginally attached workers* (Real Unemployment)

*Marginally attached workers are persons who currently are neither working nor looking for work but indicate that they want and are available for a job and have looked for work sometime in the recent past. Discouraged workers, a subset of the marginally attached, have given a job-market related reason for not currently looking for a job. Persons employed part time for economic reasons are those who want and are available for full-time work but have had to settle for a part-time schedule. For further information, see "BLS introduces new range of alternative unemployment measures," in the October 1995 issue of the Monthly Labor Review.

Source: http://www.bls.gov/webapps/legacy/cpsatab12.htm


Notice that the higher unemployment is the greater the difference between U-3 and U-6......

(Click to Enlarge)


Sunday, January 25, 2009

To The Stars and Beyond!

Exponential growth is unsustainable. a fools errand at best...... Our fearless leaders really believe that they can continue the current manner of growth for any significant period of time????


Sunday, January 4, 2009

Home Ownership Rates

I recently came across some home ownership data that was interesting in context of how it fits into the current bubble and what its potential long term consequences are. It appears that most of the US has historically been within +/- 1 standard deviation of the median home ownership rates for 30+ years, before the current housing bubble began.Click on any of the following charts to enlarge them


Northeast: Connecticut, Maine, Massachusetts, New Hampshire, Rhode Island, Vermont, New Jersey, New York, Pennsylvania.

Midwest: Illinois, Indiana, Michigan, Ohio, Wisconsin, Iowa, Kansas, Minnesota, Missouri, Nebraska, North Dakota, South Dakota.

South: Delaware, District of Columbia, Florida, Georgia, Maryland, North Carolina, South Carolina, Virginia, West Virginia, Alabama, Kentucky, Mississippi, Tennessee, Arkansas, Louisiana, Oklahoma, Texas.

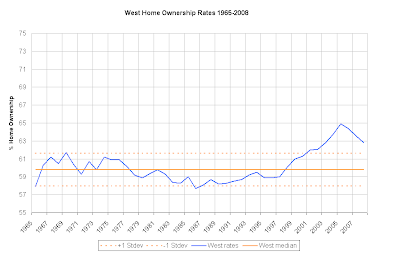
West: Arizona, Colorado, Idaho, Montana, Nevada, New Mexico, Utah, Wyoming, Alaska, California, Hawaii, Oregon, Washington.

Homeownership Rates. The proportion of households that are owners


Per 2006 census data (Source) there are 77,402,000 households in the US. The median US home ownership rate is 64.7% and the current rate is ( 1Q08) is 67.8%. A reversion to historic home ownership rates would require that 1.1 million to 3.7 million homeowners become renters, with the long term median requiring about 2.4 million homeowners to revert to renting.

For reference, there is an average of 3.9 people per household per the 06 census data.

A second bit of data I found from the same source was historical data of Asking Sale Price and Rental Prices, both nationally and regionally. The following chart shows the ratio of Asking Sales price Vs Rental Price for the Northeast and the nation.


This small set of data alone should be enough to illustrate that we will not see a recovery of the housing market anywhere in the near future. It also suggests that the northeast is still in line for a substantial correction. We have seen an approximate increase of 62% in the Northeast Asking Sales prices VS Rental price ratio in just the last 4 years when for the previous decade that ratio was staying in the neighborhood of 200.


This is also bad news for the recent buyers who bought with a plan of turning a profit on rental properties or who hope to rent their home out to cover the expense that they may not be able to afford. This last chart shows that both rents and home prices are set for a drop. While there will be some segment of the landlord population that is still positioned to profit, this will become a very tough market in the near future as their are